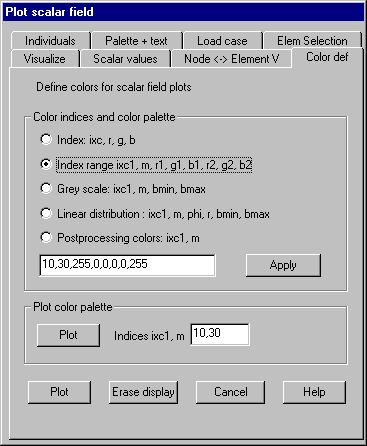
Color definition: Define color values for color
indices
This property page redefines colors associated
to color indices. RGB-values are to be given in the range of 0 – 255.
Following dialog shows the available options:

Index: ixc,
r, g, b
The color
index and associated RGB-values must be given for a single index
Index
range: ixc1, m, r1, g1, b1, r2, g2, b2
The
smallest color index ixc1 and the number m of indices for which new values
should be defined together with RGB-values for the smallest and the largest
color index must be given. Color values for all indices between are calculated
using linear interpolation.
Grey scale:
ixc1, m, bmin, bmax
The
smallest color index ixc1 and the number m of color indices together with the
brightness value for the smallest and the largest index must be given in %.
Indices between are calculated using linear interpolation.
Linear:
ixc1, m, phi, bmin, bmax
The
smallest color index ixc1, the number of indices m, the color value phi, the
smallest brightness bmin and the largest brightness bmax must be given. Color
is defined by an angle phi (0-360), a radius r (0-100) and a brightness b
(0-100) of a color cone (HLS-system).
Following
colors are assigned to angles: 0° = blue, 60° = magenta, 120° = red, 180° = yellow, 240° = green, 300° = cyan, 360° = blue.
Post
processing colors: ixc1, m
The
smallest color index ixc1 and the number m of following indices must be given.
Between these indices a smooth color transition of the colors blue, green,
yellow, red and magenta will be created.
Apply
After
setting the options this button does the calculation of the colors and updates
the color lookup tables.
Plot color
palette
This
button plots current color settings as a color bar for indices ixc1 until
ixc1+m-1.
Button „Plot“ updates the current scalar data
plot with changed color settings.