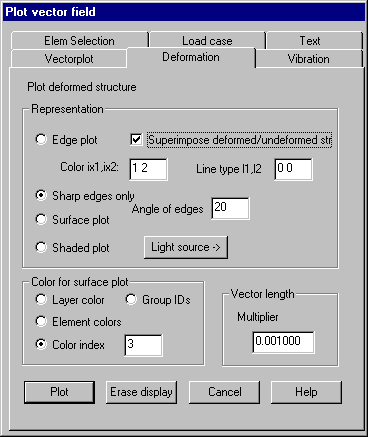
Deformation: Plot deformed structure
Vectors associated with nodes can be
interpreted as translation vectors for these nodes. With this property page
these translations can be visualized as structural deformations.
Following dialog shows the available options:

Representation
Edge plot:
The structure is plotted as a wire frame. If option „Superimpose deformed /
non-deformed structure“ is set, the non-deformed structure is plotted with
color index ix1 and line type l1 simultaneously with the deformed structure
with color index ix2 and line type l2.
Sharp edges only: Only those model edges are plotted whose angle between the normal vectors
of adjacent element surfaces exceeds the given value.
Surface plot: Plot deformed structure as a surface plot.
Shaded plot: Plot deformed structure as a shaded plot. By clicking button „Light
source“ a dialog is popped up to define additional parameters for the light
source.
Angle of edges: An angle must be given for the option “Sharp edges only” and may be
given for the options “Surface plot” and “Shaded plot”.
Color
selection for surface plots
For
surface plots the colors to be used have to be selected.
Vector
length
The
length that will be used for plotting the largest vector must be specified. The
vectors are multiplied by the given value.
Button „Plot“ plots the deformed structure;
„Erase display“ erases all display lists.