Plot: Plot associations
This command is used to checks the associations
graphically.
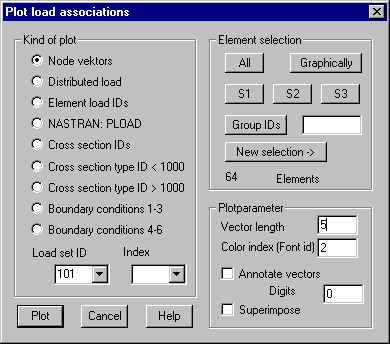
Following Dialog shows the available options:

Kind of
plot
Node vectors: The vectors associated with the selected nodes
are plotted; this may be forces, moments or displacements.
Distributed load: Plotted are statically equivalent forces belonging to loads defined
with the commands "Distributed
load " and
"Surface pressure"
Element load IDs: The element load IDs associated with the
elements are plotted as a number in the center of element gravity.
NASTRAN: PLOAD: The element surfaces that are loaded with a NASTRAN PLOAD (command
"Element loads“ with load type ID 10,13,14) are
colored.
Cross section ID: The associated cross section ID will be
plotted in the center of element gravity.
Cross section type ID < 1000: The associated cross section ID
< 1000 will be plotted in the center of element gravity (with NASTRAN
interface this are cross-sections with additional data for the element
definition).
Cross-section type ID > 1000: The associated cross section ID
> 1000 will be plotted in the center of element gravity (with NASTRAN
interface this are property records).
Boundary conditions 1-3: First 3 boundary conditions are plotted.
Boundary conditions 4-6: Boundary conditions 4 - 6 are plotted.
Load Set ID: In case a Load Set ID is given only those
values for this ID are plotted.
Index: If
a range of indices is given only the data belonging to these indices is
plotted. The list shows all used indices for the selected type of data.
Plot
parameters
Vector length: For forces, moments and boundary conditions
this value gives the maximum plotted length measured in drawing units.
Color index (Font ID): The color index used for plotting vectors respectively the font ID for
plotting numbers must be given.
Annotate vectors: If this option is set the force vectors are annotated with their value
of vector length. In the input field the number of digits used after decimal
point must be given.
Superimpose:
With this option set the previously used layer won’t be deleted prior to
plotting, so it’s possible to do multiple plots using different colors.
Element
selection
The
elements have to be selected for which the associations should be plotted.