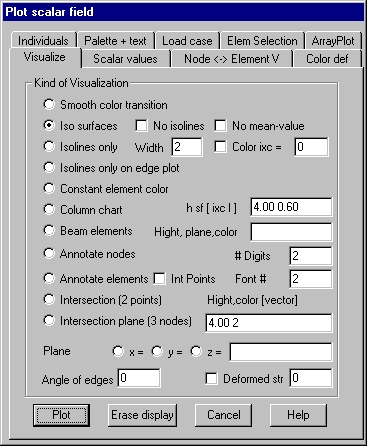
Visualize: Specify the kind of visualization
for scalar fields
On this property page you can specify the kind
of visualization to be used for subsequent plots. After setting the appropriate
option button „Plot“ starts the graphics. Button „Erase display“ can be used to
erase all display lists.
Following dialog shows the available options:

Smooth
color transition
Color
values are assigned to the nodes of the elements corresponding to the scalar
values belonging to the nodes. Among these points a continuous color transition
is used. The assignment of color indices to scalar data is done within property
page Scalar values.
Iso
surfaces
At first,
isolines are calculated for individual scalar values. Next the area between to
adjacent isolines is filled with a constant color. Optionally isolines can also
be plotted. The calculation of isolines is done by linear interpolation using
the scalar values calculated for the nodes of the triangles that approximate
the elements. If nodes belong to more than one element, the median of the
values resulting from the different elements is calculated. If option “No
median” is set, no median values are calculated, so there is no continuously
transition on element edges.
Iso lines
only
No color
filling between iso lines is done. Iso lines are plotted using a color
corresponding to the scalar value of the iso line. If option “Color ixc” is
checked, all iso lines are plotted with the given color in the input field. In
the input field for width the width for plotting the iso lines may be given.
With this option a hidden line plot is done.
Iso lines
only on edge plot
The
difference of this option to the option before is, that no hidden line plot is
done; only iso lines and element edges are plotted.
Constant
element color
With this
option set all element surfaces are filled with a constant color. The color is
determined by the associated scalar value of the element.
Column
chart
Perpendicular
to the element surfaces columns are plotted with heights proportional to the
elements scalar value. In the input field height h for the largest column,
scaling factor sf for the columns and optionally a constant color index ixc and
a flag l (shading flag) must be given. The scaling factor determines the ratio
between the width of the columns and the edge length of the elements. If there
is no color given the color is determined by the scalar value of the element.
For a flag l > 0 the columns are shaded.
Beam
elements
This
option is intended for bar and beam elements with scalar fields of type ktyp =
30 – 33. Perpendicular to the axis of the element the distribution of the
scalar values is plotted as a colored bar in the given plane. In the input
field, following parameters must be given: Plotted height for the maximal
scalar value, 3 components of a vector lying on the plane in which the
distribution should be plotted and the color to be used for the plot. The
vector must not be parallel to a beam axis. Several plots are superimposed.
Annotate
nodes
With this
option all nodes contained within the current selection are annotated with
associated scalar values. The number of digits following the decimal point and
the font index (1-3) for text height and color must be given.
Annotate
elements
This
option shows the associated scalar value for the elements at the center of
gravity. Further options are the same as with option “Annotate nodes”. If
scalar values are given for integration points, option “Integr point” can be
checked; in this case the integration points are annotated with corresponding
scalar values.
Intersection
(2 points)
With this
option 2 points defining the end points of an intersection line must be
graphically selected within the current view after pressing button „Plot“. On
each intersection line all scalar values at the intersection of the line with
element edges are calculated using linear interpolation. The scalar values are
plotted along the intersection line. Within the input field maximum height for
scalar distribution, color index for filling and optionally 3 components of a
direction vector for the surface can be given. In case there is no direction
vector given the plot is done perpendicular to the elements surface. Several
intersection lines can be selected sequentially until right mouse button is
pressed.
Intersection
plane (3 points)
By
selecting 3 points after pressing button “Plot”, a spatial intersection plane
is generated. Scalar values are calculated at all intersections between this
plane and element edges. Scalar values are plotted within this intersection
plane. Additional parameters to be specified are the same as with option
“Intersection”.
Plane x, y, z
This
options do intersections parallel to global coordinate system planes. Within
the input field several values for x,y or z-coordinates of these intersection
planes can be given.
Angle of
edges
If an
angle > 0 (degrees) is given only these element edges are plotted whose
angles between the normal vectors of adjacent element surfaces are greater than
this value.
Deformed
structure
With this
option set the plot is done within the deformed element structure. This is only
applicable if there is also a vector field with node displacements loaded and
activated by the command Vector
field. The
maximum length for displaying a displacement must be given.